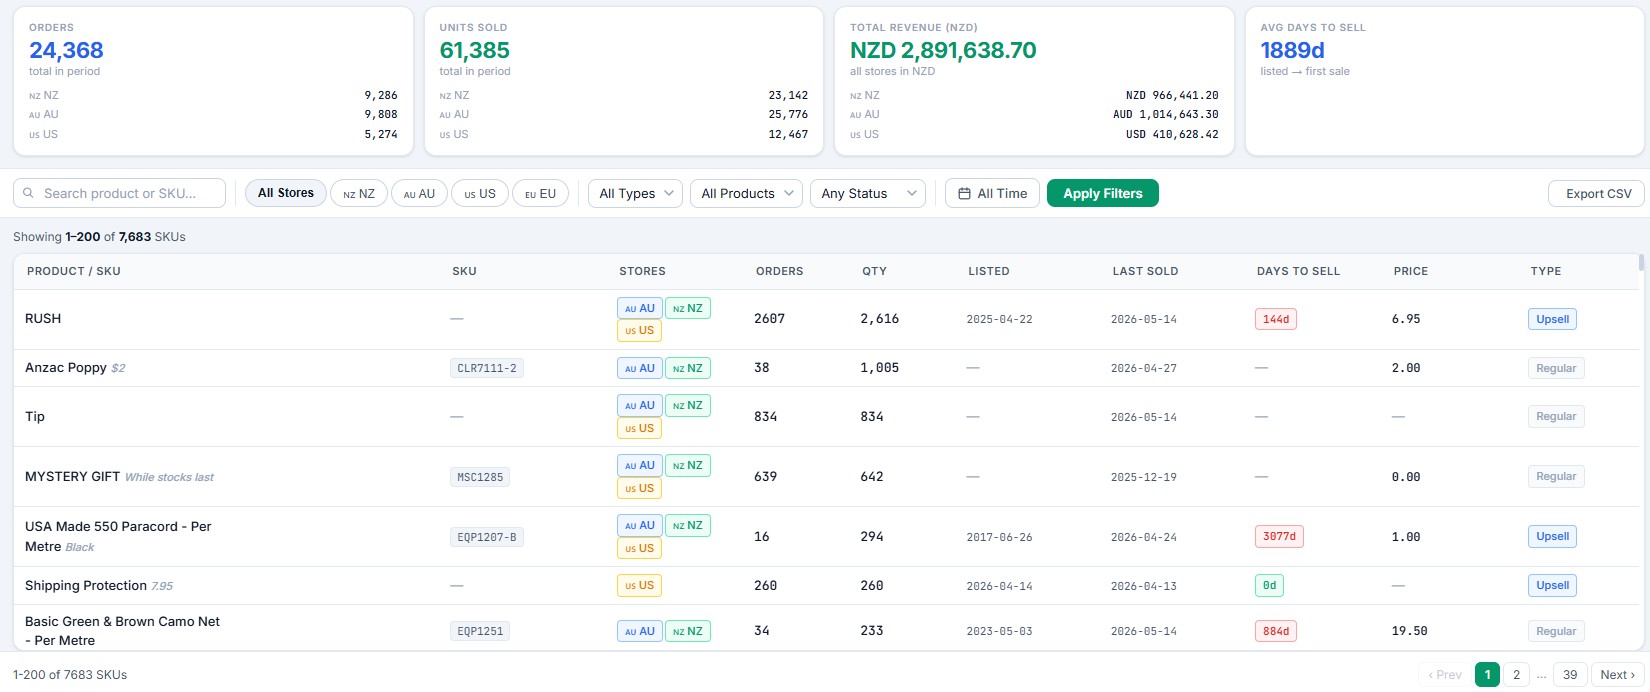
The screenshot
Live data from the production system (May 2026):

Per-store stat tiles, SKU-level cross-store performance table, days-to-sell colour coding, and filter controls.
The problem
Reporting on 4 regional Shopify stores (NZ, AU, US, EU) meant 4 separate Admin logins, 4 separate CSV exports, and then hours in Excel doing what Shopify wouldn't:
- Convert currencies manually. AUD orders had to be hand-converted to NZD using whatever FX rate someone copied off Google that day. Comparisons across stores were unreliable.
- See cross-store SKU performance. Was a product selling in AU but dying in US? You couldn't tell from Shopify Admin without pulling two CSVs and VLOOKUPing them together.
- Track days-to-sell. Which products had been sitting in inventory for months without moving? Shopify doesn't surface this. The purchasing team was guessing.
- Filter across stores at the same time. Want to see "all products tagged X, sold in the last 90 days, across NZ and AU only"? Three CSV exports and 45 minutes in Excel.
The whole exercise of running cross-store reports was eating hours every week and producing data that was always slightly wrong because of stale FX rates and copy-paste errors.
The solution
Built a custom PHP / MySQL reporting platform from scratch. Five core tables: orders, line items, products, stores, FX rates. All data flows in from Shopify via webhooks — every order, every product update, every inventory change — and lands in the local database in near real-time.
What's in the dashboard
- Per-store stat tiles — Orders, Units Sold, Total Revenue (NZD), Avg Days to Sell. Each tile shows the per-store breakdown (NZ / AU / US / EU) plus a unified total.
- Total Revenue in unified NZD — converts AUD, USD, EUR to NZD using a daily FX rate sync from a live FX API. No more stale Google rates. No more manual conversion.
- SKU-grouped cross-store view — one row per SKU. Columns show which stores carry it, total orders, quantity, listed date, last sold date, days to sell, and price. 7,683 SKUs in production.
- Days-to-sell colour coding — green = fresh / fast mover, red = slow / dead stock. The purchasing team can spot dead inventory in seconds.
- Filter panel — store (NZ/AU/US/EU), order status, date range, free-text product/SKU search. Filters apply across the entire dataset, not just the current page.
- Shopify-style date range picker — with built-in compare periods (week-over-week, month-over-month, year-over-year).
- Sortable + resizable columns — saves user preferences in browser storage.
- CSV export — exports the filtered view (not the full dataset) so the report you build is the report you get.
- Pagination + infinite scroll — 200 rows per page, 39 pages of SKUs, no UI lag.
The technical bits worth noting
- Webhook reliability pattern — every Shopify webhook hits the dashboard endpoint, gets HMAC-verified, responds HTTP 200 immediately, then queues for processing. No retry storms, no missed events.
- FX rate caching — rates fetched once daily and cached locally. If the FX API fails, the system falls back to the previous day's rates instead of breaking.
- Server — PHP 8.1 on CloudPanel / Nginx. Internal-only access (not exposed publicly).
- Bug fixes during build — caught and fixed PDO placeholder mismatches, invalid MySQL CASE boolean patterns, and a calendar hover handler that was destroying DOM elements before click events could fire. The kind of bugs you only find by running the thing in production.
The result
The dashboard is now the daily decision-making tool for the AAO team — purchasing, marketing, and finance all use it. Specifically:
- Cross-store visibility in seconds instead of hours. "Show me the top 50 fast-movers across NZ and AU in the last 30 days" — one filter combination, one click.
- Reliable FX-converted totals. No more "the AU number doesn't match because someone used yesterday's rate". Finance trusts the numbers.
- Dead stock identification. The days-to-sell colour coding caught products that had been sitting unsold for 1,000+ days. Purchasing can now make informed delist / clearance decisions.
- One source of truth. Replaces 4 Admin logins + Excel pipelines with one URL. Onboarding new team members takes minutes, not weeks.
Why this matters for your store
If you're running multi-region Shopify and your reporting still lives in 4 separate Admin tabs + spreadsheets, you're making decisions on stale, partial, or wrong data. This isn't a "nice to have" — it's the difference between knowing your business and guessing.
I've built this exact system in production. The patterns transfer to any multi-region setup. If you want to see what a unified reporting layer would look like for your stack, I can scope it.